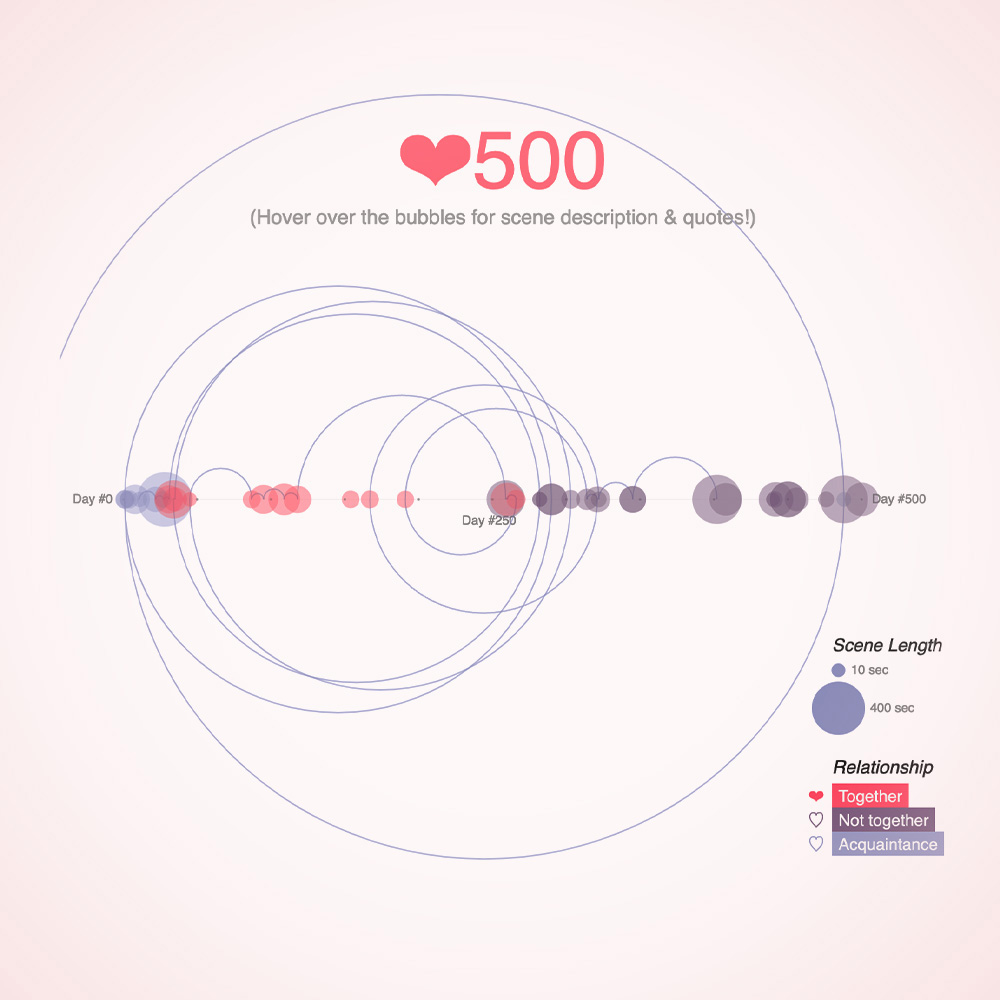
This course is for working professionals who are interested in learning the key concepts and techniques for creating effective visualizations based on principles from graphic design, visual art, perceptual psychology, and cognitive science to create graphical displays for summarizing and reasoning quantitative information. It is a 6 day course offered as a synchronous online course delivered over 6 weekends. The course counts towards 6 credits in the ePGD programme in Interaction Design offered by IDC School of Design, IIT Bombay.

This programme is for you if you are:
The table below shows the planned contents for the 6 day online course. The course can be conducted either as one full day (either Sat or Sun) or as two half days (both Sat & Sun) depending on the majority preference of the course participants. There are no prerequisites, however fluency with spreadsheet (Excel or Google Sheet) and familiarity with any of the free and/or open source visualization tools such as Tableau, Flourish, Google Data Studio, Datawrapper, Chart.js etc., is highly desirable. Datasets required for exercises and assignments will be provided.
You have an undergraduate degree (or equivalent) from a recognised university in any of these disciplines: design, engineering, architecture, fine arts, applied arts, information architecture, ergonomics / human factors, writing and communication.
OR
OR, if you have any other undergraduate degree from a university recognised by IIT Bombay and if you have work experience in the industry of 3 years or more in any of these roles: user interface designer, user experience designer, web developer, information architect, graphic designer, visual designer, copywriter, product manager, brand manager.
OR
OR, if you have any undergraduate degree from a university recognised by IIT Bombay other than design, engineering, architecture, fine arts, applied arts, information architecture, ergonomics / human factors, writing and communication, and have qualified in the CEED exam.